cosmos.wikisort.org - Spacecraft
Interface Region Imaging Spectrograph (IRIS),[1] also called Explorer 94 and SMEX-12,[2] is a NASA solar observation satellite. The mission was funded through the Small Explorer program to investigate the physical conditions of the solar limb, particularly the interface region made up of the chromosphere and transition region. The spacecraft consists of a satellite bus and spectrometer built by the Lockheed Martin Solar and Astrophysics Laboratory (LMSAL), and a telescope provided by the Smithsonian Astrophysical Observatory (SAO). IRIS is operated by LMSAL and NASA's Ames Research Center.
 Interface Region Imaging Spectrograph (Explorer 94) satellite | |
| Names | Explorer 94 IRIS SMEX-12 |
|---|---|
| Mission type | Heliophysics |
| Operator | NASA / Lockheed Martin |
| COSPAR ID | 2013-033A |
| SATCAT no. | 39197 |
| Mission duration | 2 years (planned) 9 years, 3 months, 12 days (in progress) |
| Spacecraft properties | |
| Spacecraft | Explorer XCIV |
| Spacecraft type | Interface Region Imaging Spectrograph |
| Bus | IRIS |
| Manufacturer | Lockheed Martin |
| Launch mass | 200 kg (440 lb) |
| Start of mission | |
| Launch date | 28 June 2013, 02:27:46 UTC |
| Rocket | Pegasus-XL (F42) |
| Launch site | Vandenberg, Stargazer |
| Contractor | Orbital Sciences Corporation |
| Orbital parameters | |
| Reference system | Geocentric orbit |
| Regime | Sun-synchronous orbit |
| Perigee altitude | 623 km (387 mi) |
| Apogee altitude | 665 km (413 mi) |
| Inclination | 97.90° |
| Period | 97.47 minutes |
| Instruments | |
| Interface Region Imaging Spectrograph (IRIS) | |
Explorer program | |
The satellite's instrument is a high-frame-rate ultraviolet imaging spectrometer, providing one image per second at 0.3 arcsecond angular resolution and sub-ångström spectral resolution.
NASA announced, on 19 June 2009, that IRIS was selected from six Small Explorer mission candidates for further study,[3] along with the Gravity and Extreme Magnetism (GEMS) space observatory.[4]
Mission
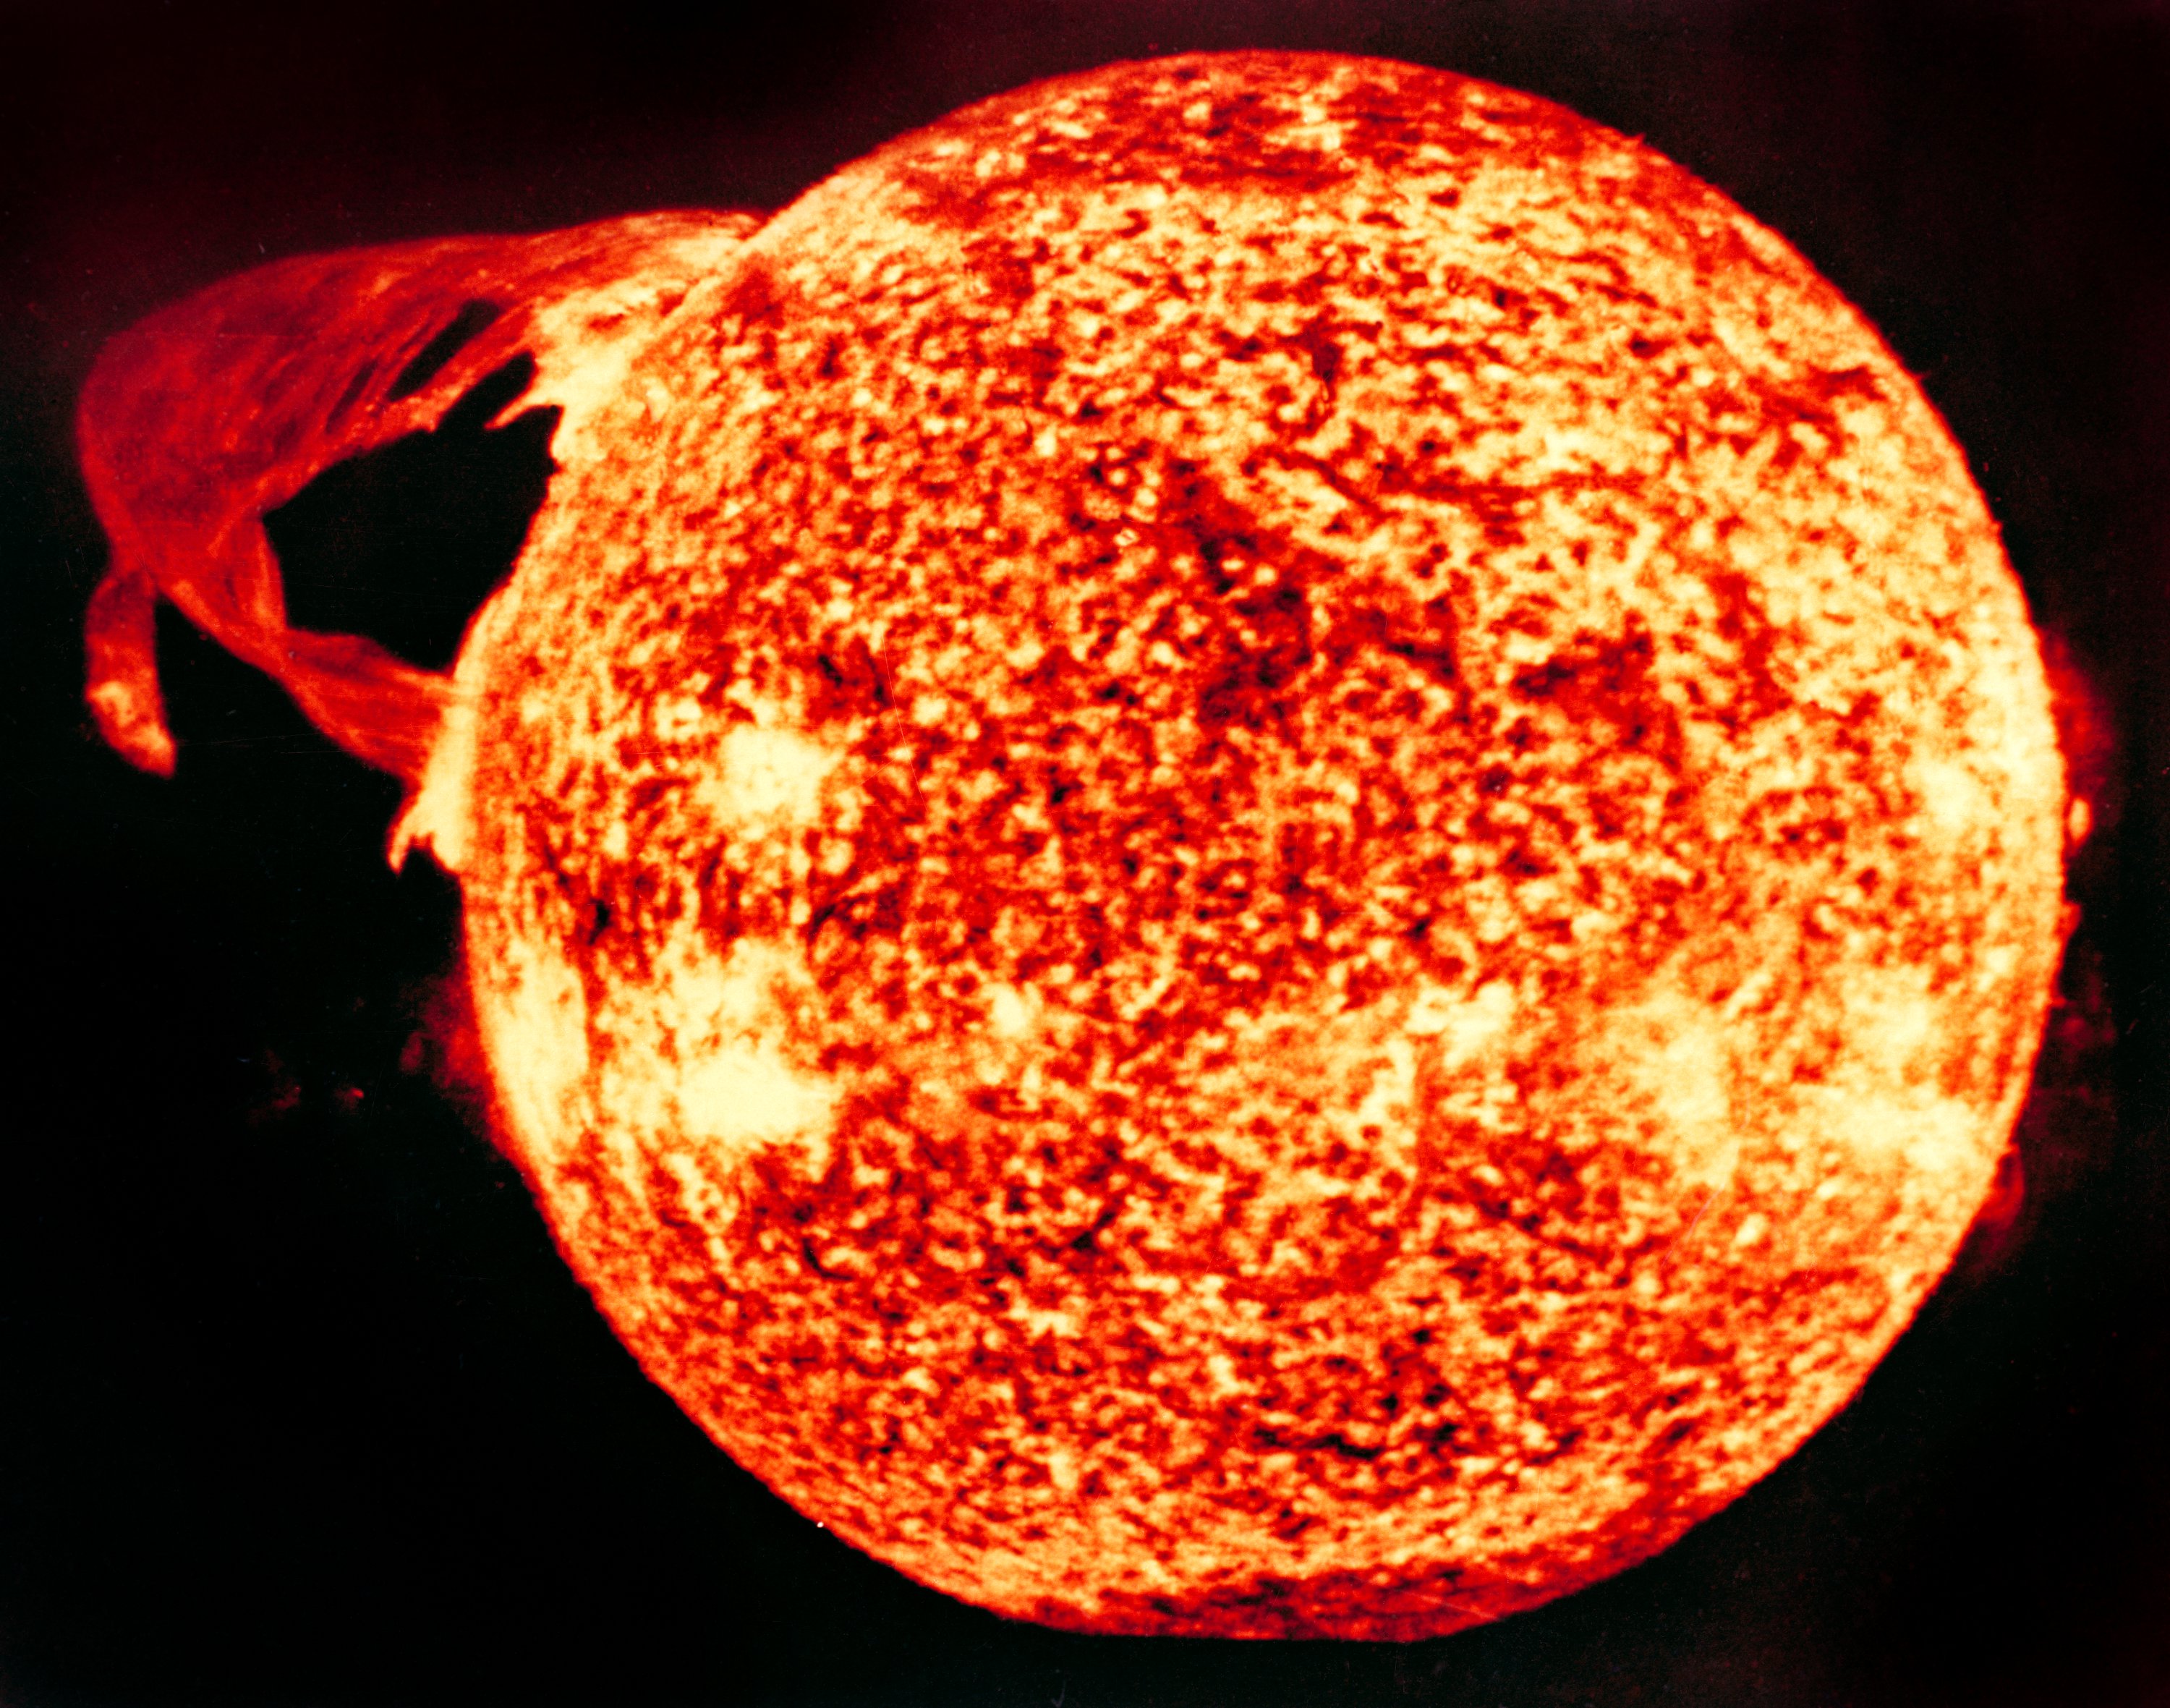
IRIS is intended to advance Sun-Earth connection studies by tracing the flow of energy and plasma into the corona and heliosphere for which no suitable observations exist. To achieve this IRIS obtains a high-resolution UV spectra and images of the sun's chromosphere, specifically on the non-thermal energy that creates the corona and the solar wind. IRIS seeks to determine: (1) the types of non-thermal energy which dominate in the chromosphere and beyond; (2) the means by which the chromosphere regulates mass and energy supply to the corona and heliosphere; and, (3) how magnetic flux and matter rise through the lower solar atmosphere, and the role played by flux emergence in flares and mass ejections. To answer these questions, IRIS utilize a single instrument, a multi-channel imaging spectrograph.[1]


Launch

The spacecraft arrived at Vandenberg Air Force Base, California, on 16 April 2013 and was successfully deployed from an Orbital L-1011 carrier aircraft flying over the Pacific Ocean at an altitude of 12,000 m (39,000 ft), roughly 160 km (99 mi) northwest of Vandenberg. The launch vehicle was dropped at 02:27:46 UTC on 28 June 2013 (7:27 p.m. PDT on 27 June 2013) by a Pegasus-XL launch vehicle.[5][6][1]
Experiment
Interface Region Imaging Spectrograph (IRIS)
The IRIS instrument is a multi-channel imaging spectrograph with a 20 cm (7.9 in) ultraviolet telescope. IRIS obtains a spectra along a slit (1/3 arcsecond wide), and slit-jaw images. The charge-coupled device (CCD) detectors has 1/6 arcsecond pixels. IRIS will have an effective spatial resolution between 0.33 and 0.40 arcsecond and a maximum field of view (FoV) of 120 arcseconds. The far-ultraviolet channel covers 133.2-135.8 nm and 139.0-140.6 nm with a 4 nm resolution and an effective area of 2.8 cm2 (0.43 sq in). The near-ultraviolet channel covers 278.5-283.5 nm with a 8 nm resolution and an effective area of 0.3 cm2 (0.047 sq in). Slit-jaw imaging has four passbands: 133.5 nm and 140.0 nm with a 4 nm bandpass each; and 279.6 nm and 283.1 nm with a 0.4 nm bandpass each. IRIS has a high data rate (0.7 Mbit/s on average) so that the baseline cadence is 5 seconds for slit-jaw images and 1 second for six spectral windows, including rapid rastering to map solar regions.[7]
Science results
IRIS achieved first light on 17 July 2013.[8] NASA noted that "IRIS's first images showed a multitude of thin, fibril-like structures that have never been seen before, revealing enormous contrasts in density and temperature occur throughout this region even between neighboring loops that are only a few hundred miles apart".[8] On 31 October 2013, calibrated IRIS data and images were released on the project website.[9] An open-access article describing the satellite and initial data was published in the journal Solar Physics.[10]
Data collected from the IRIS spacecraft has shown that the interface region of the Sun is significantly more complex than previously thought. This includes features described as solar heat bombs, high-speed plasma jets, nano-flares, and mini-tornadoes. These features are an important step in understanding the transfer of heat to the corona.[11]
In 2019, IRIS detected tadpole like jets coming out from the Sun according to NASA.[12]
- Video of IRIS data from a solar flare on 11 March 2015
 X-class solar flare on Sept. 10, 2014
 IRIS captured several large solar prominences on the edge of the sun
 IRIS view above the sun's surface extending well out into the solar atmosphere


IRIS team
Science and engineering team members include:[9]
- Lockheed Martin Solar and Astrophysics Laboratory
- Lockheed Martin Sensing and Exploration Systems
- Smithsonian Astrophysical Observatory
- Montana State University
- Institute for Theoretical Astrophysics, University of Oslo
- High Altitude Observatory, National Center for Atmospheric Research
- Stanford University
- NASA Ames Research Center
- NASA Goddard Space Flight Center
- National Solar Observatory
- Space Sciences Laboratory, University of California, Berkeley
- Princeton Plasma Physics Laboratory
- Sydney Institute for Astronomy, University of Sydney
- Center for Plasma Astrophysics, Catholic University of Leuven
- Mullard Space Science Laboratory
- Rutherford Appleton Laboratory
- European Space Agency
- Max Planck Institute for Solar System Research
- National Astronomical Observatory of Japan
- Niels Bohr Institute, University of Copenhagen
See also
- Explorer program
References
- "Display: IRIS (Explorer 94) 2013-033A". NASA. 28 October 2021. Retrieved 12 December 2021.
 This article incorporates text from this source, which is in the public domain.
 - "NASA's Explorer Program Satellites". NASA. 22 July 2019. Retrieved 12 December 2021. This article incorporates text from this source, which is in the public domain.
- Harrington, J. D. (29 May 2008). "NASA Selects Small Explorer Investigations for Concept Studies". NASA. This article incorporates text from this source, which is in the public domain.
- Harrington, J. D. (19 June 2009). "NASA Awards Two Small Explorer Development Contracts". NASA. This article incorporates text from this source, which is in the public domain.
- Hendrix, Susan; Diller, George (17 April 2013). "NASA'S Newest Solar Satellite Arrives at Vandenberg AFB for Launch". NASA. This article incorporates text from this source, which is in the public domain.
- "IRIS Solar Observatory Launches, Begins Mission". NASA. 28 June 2013. This article incorporates text from this source, which is in the public domain.
- "Experiment: Interface Region Imaging Spectrograph (IRIS)". NASA. 28 October 2021. Retrieved 12 December 2021. This article incorporates text from this source, which is in the public domain.
- Fox, Karen C. (25 July 2013). "NASA's IRIS Telescope Offers First Glimpse of Sun's Mysterious Atmosphere". NASA. Retrieved 29 July 2013. This article incorporates text from this source, which is in the public domain.
- "Interface Region Imaging Spectrograph". Lockheed Martin Solar and Astrophysics Laboratory.
- De Pontieu, B.; Title, A. M.; Lemen, J.; Kushner, G. D.; Akin, D. J.; et al. (July 2014). "The Interface Region Imaging Spectrograph (IRIS)". Solar Physics. 289 (7): 2733–2779. arXiv:1401.2491. Bibcode:2014SoPh..289.2733D. doi:10.1007/s11207-014-0485-y. S2CID 53596913.
- De Pontieu, B.; Rouppe van der Voort, L.; McIntosh, S. W.; Pereira, T. M. D.; Carlsson, M.; et al. (October 2014). "On the prevalence of small-scale twist in the solar chromosphere and transition region". Science. 346 (6207): 1255732. arXiv:1410.6862. Bibcode:2014Sci...346D.315D. doi:10.1126/science.1255732. PMID 25324398. S2CID 51601695.
- "Tadpole-Like Jets From Sun Add New Clue to Age-Old Mystery". NASA. 19 February 2019. Retrieved 10 April 2019. This article incorporates text from this source, which is in the public domain.
External links
- IRIS website by NASA
- IRIS website by NASA Goddard Space Flight Center
- IRIS website by Lockheed Martin
- De Pontieu, B., Title, A.M., Lemen, J.R. et al. The Interface Region Imaging Spectrograph (IRIS) Sol Phys 289, 2733–2779 (2014) https://doi.org/10.1007/s11207-014-0485-y
- De Pontieu, B., Polito, V., Hansteen, V. et al. A New View of the Solar Interface Region from the Interface Region Imaging Spectrograph (IRIS) Sol Phys 296, 84 (2021) https://doi.org/10.1007/s11207-021-01826-0
Explorers Program | |||
|---|---|---|---|
List of Explorers Program missions | |||
| Missions | |||
| Proposals |
| ||
| |||
Solar space missions | ||
|---|---|---|
| Current |
|   |
| Past |
| |
| Planned |
| |
| Proposed |
| |
| Cancelled |
| |
| Lost |
| |
| Sun-Earth | ||
| ||
Space observatories | |
|---|---|
| Operating |
|
| Planned |
|
| Proposed |
|
| Retired |
|
| Hibernating (Mission completed) | |
| Lost/Failed |
|
| Cancelled | |
| Related |
|
| |
2013 in space | ||||||
|---|---|---|---|---|---|---|
| ||||||
| Space probe launches |
|    | ||||
| Impact events | ||||||
| Selected NEOs | ||||||
| Exoplanets |
| |||||
| Discoveries |
| |||||
| Novae | ||||||
| Comets |
| |||||
| Space exploration |
| |||||
| ||||||
На других языках
[de] Interface Region Imaging Spectrograph
Interface Region Imaging Spectrograph (IRIS) ist ein Weltraumteleskop zur Erforschung der Sonnenatmosphäre. IRIS ist ein Satellit im Explorer-Programm der NASA. Nach dem Erreichen der Umlaufbahn hat IRIS die zusätzliche Bezeichnung Explorer 94 erhalten.- [en] Interface Region Imaging Spectrograph
[ru] IRIS (спутник)
IRIS (Interface Region Imaging Spectrograph) — космический аппарат NASA для исследования Солнца. Миссия в рамках программы Small Explorer program (SMEX) по исследованию физических свойств солнечного лимба — видимого края диска Солнца, солнечной хромосферы. Построен аппарат для лаборатории Lockheed Martin Solar and Astrophysics Laboratory (LMSAL). На космическом аппарате установлен спектрометр, который создан лабораторией LMSAL, и телескоп Смитсоновской астрофизической обсерватории. Управлять аппаратом на орбите будут лаборатория LMSAL и Исследовательский центр Эймса NASA.Другой контент может иметь иную лицензию. Перед использованием материалов сайта WikiSort.org внимательно изучите правила лицензирования конкретных элементов наполнения сайта.
WikiSort.org - проект по пересортировке и дополнению контента Википедии